A Data Analytics Enthusiast

Simplifying the world,
One dataset at a time.
I'm fuelled by using data to simplify complexities into actionable insights!
MY PROJECTS PORTFOLIO
MY ARTICLES
ABOUT ME
View My LinkedIn Profile
Building Machine Learning Models using Python
Module Introduction
Python was the final language in the curriculum. We had started off with the basics (of data types, flow control, functions, dictionaries, classes, etc.), learnt how to automate repetitive tasks, data analytics, create dashboards, and build machine learning models (of linear regression, k-nearest neighbours, support vector machines, random forests, neural networks, deep learning with Keras and TensorFlow, etc).
Capstone Project 4: Build Machine Learning Models for the Instagram Top Post
Click here to download my PowerPoint Presentation Show
Click here to download my Jupyter Notebook Code

Abstract
In today’s society, smartphones have become ubiquitious and an essential tool for most of us. Especially with the lockdown of COVID-19, humans have increasingly turned to social media platforms to get their daily fixes of interaction. Instagram is one of the most-used social platforms today, with a concept built around image and video sharing. While the app started off based on personal interactions, it has now evolved to encompass business-to-consumer interactions, making the landscape increasingly competitive and thus, imperative to capture customers’ attention by having their content as one of the top posts.
This project aims to better understand Instagram’s algorithm and, from a user-standpoint - find out which are the “super” variables to focus efforts on, in the trajectory to making Instagram top posts.
Top Posts in the Explore and Home tabs

Dataset Introduction
The Instagram Top Post Dataset consists of 16 independent variables (of like_count, hashtag_count, is_verified, is_video, etc.) with a target column of “is_top”. It is a balanced dataset which contains a total of 2170 entries.
Problem Statement
Which variables hold higher weightage in making a post come up on top? The dataset has a target column of is_top, with binary data of “Y” or “N”. This project adopts a supervised learning approach, using Machine Learning Models of Logistic Regression and Random Forest in sifting out the “super” variables.
Process Workflow
The dataset was checked and clean of missing values, datatypes were streamlined into two types (object, and non-object) to enable easy visualizations for the purpose of exploratory data analysis. Data was then pre-processed using label-encoding and one-hot-encoding, and then data was split and model trained. Due to the data being previously categorical and numerical, the range of the encoding was wide and so I scaled the data using sklearn.preprocessing’s StandardScaler, then fitted it to the training data and applied transformations to the data.
I warmed up by doing a baseline model using Logistic Regression and took note of the F1 Score.
After which I got down to serious business by setting up my first machine learning model (Logistic Regression), then getting down and dirty with hyperparameter tuning. Using the best hyperparameters and estimators (from my tuning), I fitted them to the training data, predicted with the test data, to obtain the classification report for the model. The machine learning Logistic Regression model’s F1 Score topped the baseline model. I am happy.
Next, I carried out the same steps with my second machine learning model (Random Forest) - Setup the classifier, hyperparameter tuning, fitting… you get the drift. This new model’s F1 Score topped the previous (Logistic Regression). With Random Forest as my best model, I moved on to predicting and evaluating using my test data.
Comparison of Random Forest and Logistic Regression Model’s Metrics
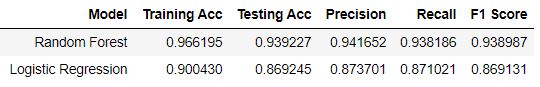
Results
Fortunately, the model metrics for the test data did not vary significantly (vs the training data).
Classification Report of Test Data using Random Forest
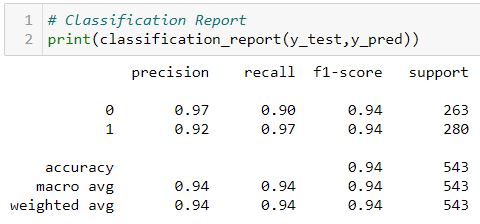
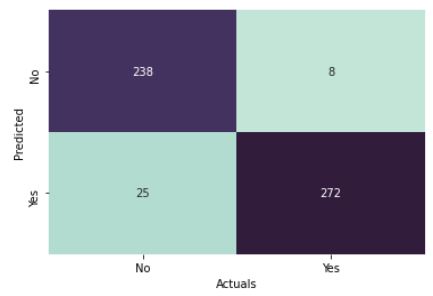
The results look good as well with immaterial False Postives and False Negatives.
Results in a Confusion Matrix Visualization
Having plotted the features importance into a visualization, we can deduce that the top “super” variables are like_count, comments_count, and followers_count.
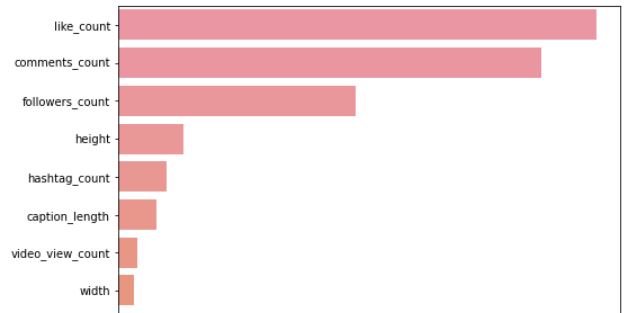
The data-driven approach suggests to focus on creating content which:
- aim to provide instant gratification –> like_count
- encourages engagement –> comments_count
- is addictive –> followers
But of course, that being said, life is a mix of the quants and qualitative aspects and so we need to consider the latter as well :)
Project Scoring Rubrics
We were rated on 5 components of:
- Design (5 points)
- Data (5 points)
- Algorithms (5 points)
- Tools (5 points)
- Communication (5 points)
I presented the above-mentioned to “The Boss”.
He was pleased.
He awarded my efforts with a PERFECT score of 25/25.
I am more than pleased.

Contact me
| https://www.linkedin.com/in/megan-ng-7708a74/ | |
| megan_ng@hotmail.com |
Hosted on GitHub Pages — Theme by orderedlist