A Data Analytics Enthusiast

Simplifying the world,
One dataset at a time.
I'm fuelled by using data to simplify complexities into actionable insights!
MY PROJECTS PORTFOLIO
MY ARTICLES
ABOUT ME
View My LinkedIn Profile
SQL
Module Introduction
Structured Query Language was the fourth core in the curriculum after the modules of Basics of Data Science, Power Query, and Excel. We started off with an introduction to databases, schemas, Entity-Relationship Diagrams, then moved on to SQL datatypes, basic commands, conditional operators, functions and aggregate functions, set operators, joins, and finished off with stored procedures.
This Capstone Project was designed to ignite our cognitive process, reinforce and apply our knowledge to “real-life” cases so as to solidify our learnings. We were graded on our ability to showcase and exhibit the five stages of the data lifecycle through the use of SQL and Excel (data collection, creating tables and loading data into SQL databases, data preparation, data analysis using SQL, creating Excel interactive dashboard and visualizations, presentation to stakeholders).
Capstone Project 2: The Movie Industry, An Overview
Click here to download my SQL code
Click here to download my Excel Interactive Dashboard
Click here to download my PowerPoint Presentation Show
Abstract
As like most things in life, there are a plethora of variables as to what makes a movie a “success”. This project is based off the angle that my target audience is looking towards going into the movie business and would like to get a overall sense of the movie industry.
Dataset Introduction
The Movies Dataset consists of 7 csv files (credits, keywords, links, moview_metadata, ratings, etc.). For this project’s context, I have only used the following 4:
- movies_metadata.csv (45,000+ rows) - contains info on movies with attributes of release dates, franchise family, genres, budget, revenue, homepages, production companies, etc.
- credits.csv (45,000+ rows) - consists of cast and crew information per movie, in the form of a stringified JSON object
- ratings.csv (more than 1,048,576 rows) - contains the TMDB and IMDB IDs of all the movies featured in the Full MovieLens dataset
- links.csv (45,000+ rows) - list of mappings of corresponding TMDB, IMDB, and Movie IDs
The files are too massive to process in excel, and so SQL comes in to save the day!
Files are massive to even load in Github!
Just the ratings file alone is 692,921 KB.
Problem Statement
What is the direction I should take in coming up with my debut movie?
Some of the questions answered include:
- How does the trend of released movies look like from the angles of year-on-year, month-on-month?
- What are the most often produced genres?
- What movies have the highest return-on-investment?
- What movies raked in the most revenue?
Process Workflow
Planning
As Benjamin Franklin said,
“If you fail to plan, you are planning to fail.”
Likewise when dealing with databases, it is good practice (an essential, for me), to start off with planning.
I did this by doing up an ER-diagram:
Creating Database, Loading Data, Data Preparation
In the SQL Server, I created a new database named MOVIES, uploaded the files, used aggregate functions to check for duplicate rows and deleted the duplications in the files.
Data Analysis
Moving on to the Data Analysis part, as usual, I took a top-down approach in analysing the data as I like to have an overall feel of what the dataset is about before I drill down into the nitty gritties (which might overwhelm if I started off there).
Then, I started drilling down to find out:
- The spread of the dataset (number of movies released per year, per month
- Year-on-year comparison of number of movies released by month for the last 5 years (pivot table)
- Number of movies per genre
- Top 30 movies with the highest return on investment for the last 20 years
- Top 30 movies which bring in the most revenue for the last 20 years
- Which genre was produced the most in the last 20 years
- Details of top 200 movies (with details) with top engagement (no_of_raters)
Data Manipulation
And finally, I created a data dump for the Excel Dashboard by creating views and joining all the relevant views and tables together.
I imported the data dump into Excel, did the necessary pivot tables, visualizations, arranged them on the Dashboard, and did the slicers to enable interactions.
Dashboard Takeaways
I presented the following takeaways to the Boss.
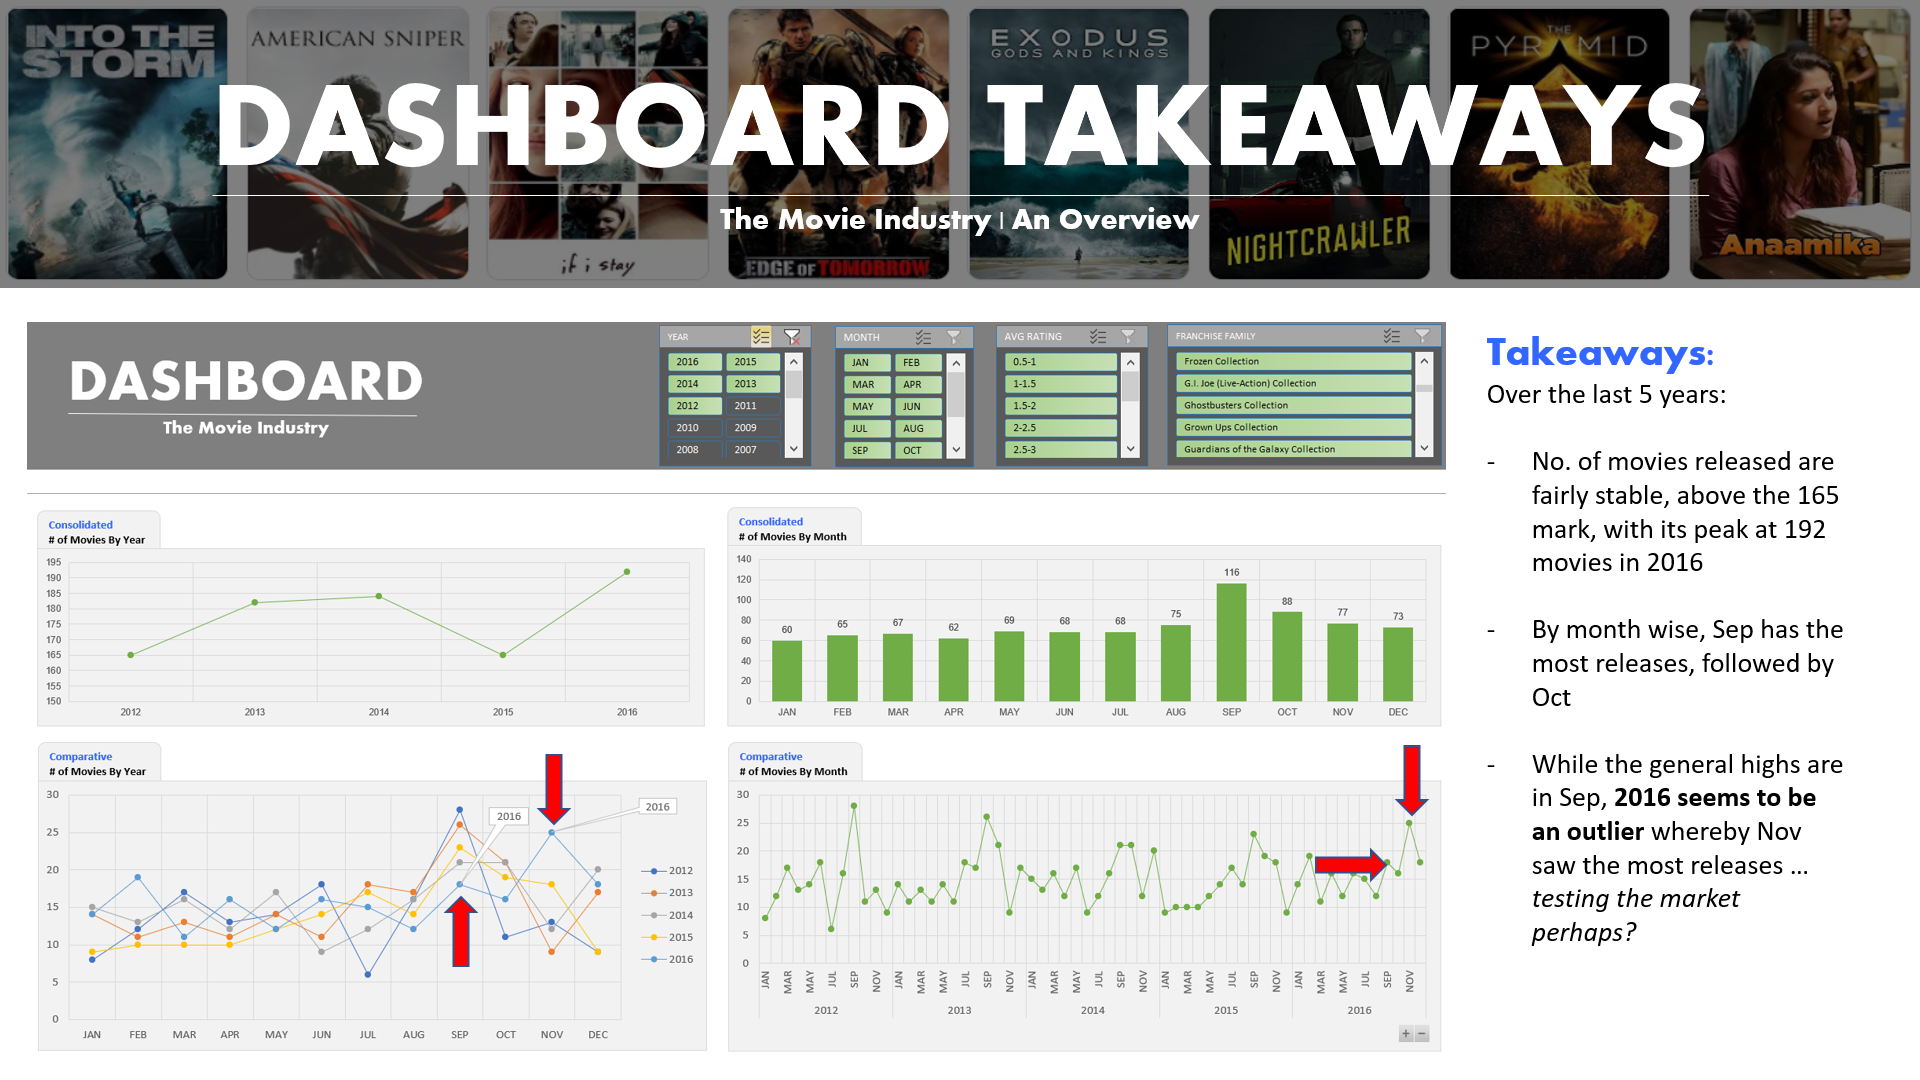
- Over the last 5 years:
- The number of movies released are fairly stable, above the 165 mark, with its peak at 192 movies in 2016
- By month-wise, September has the most releases, followed by October
- While the general highs are in Sep, 2016 seems to be an outlier whereby November saw the most releases… testing the market perhaps?
-
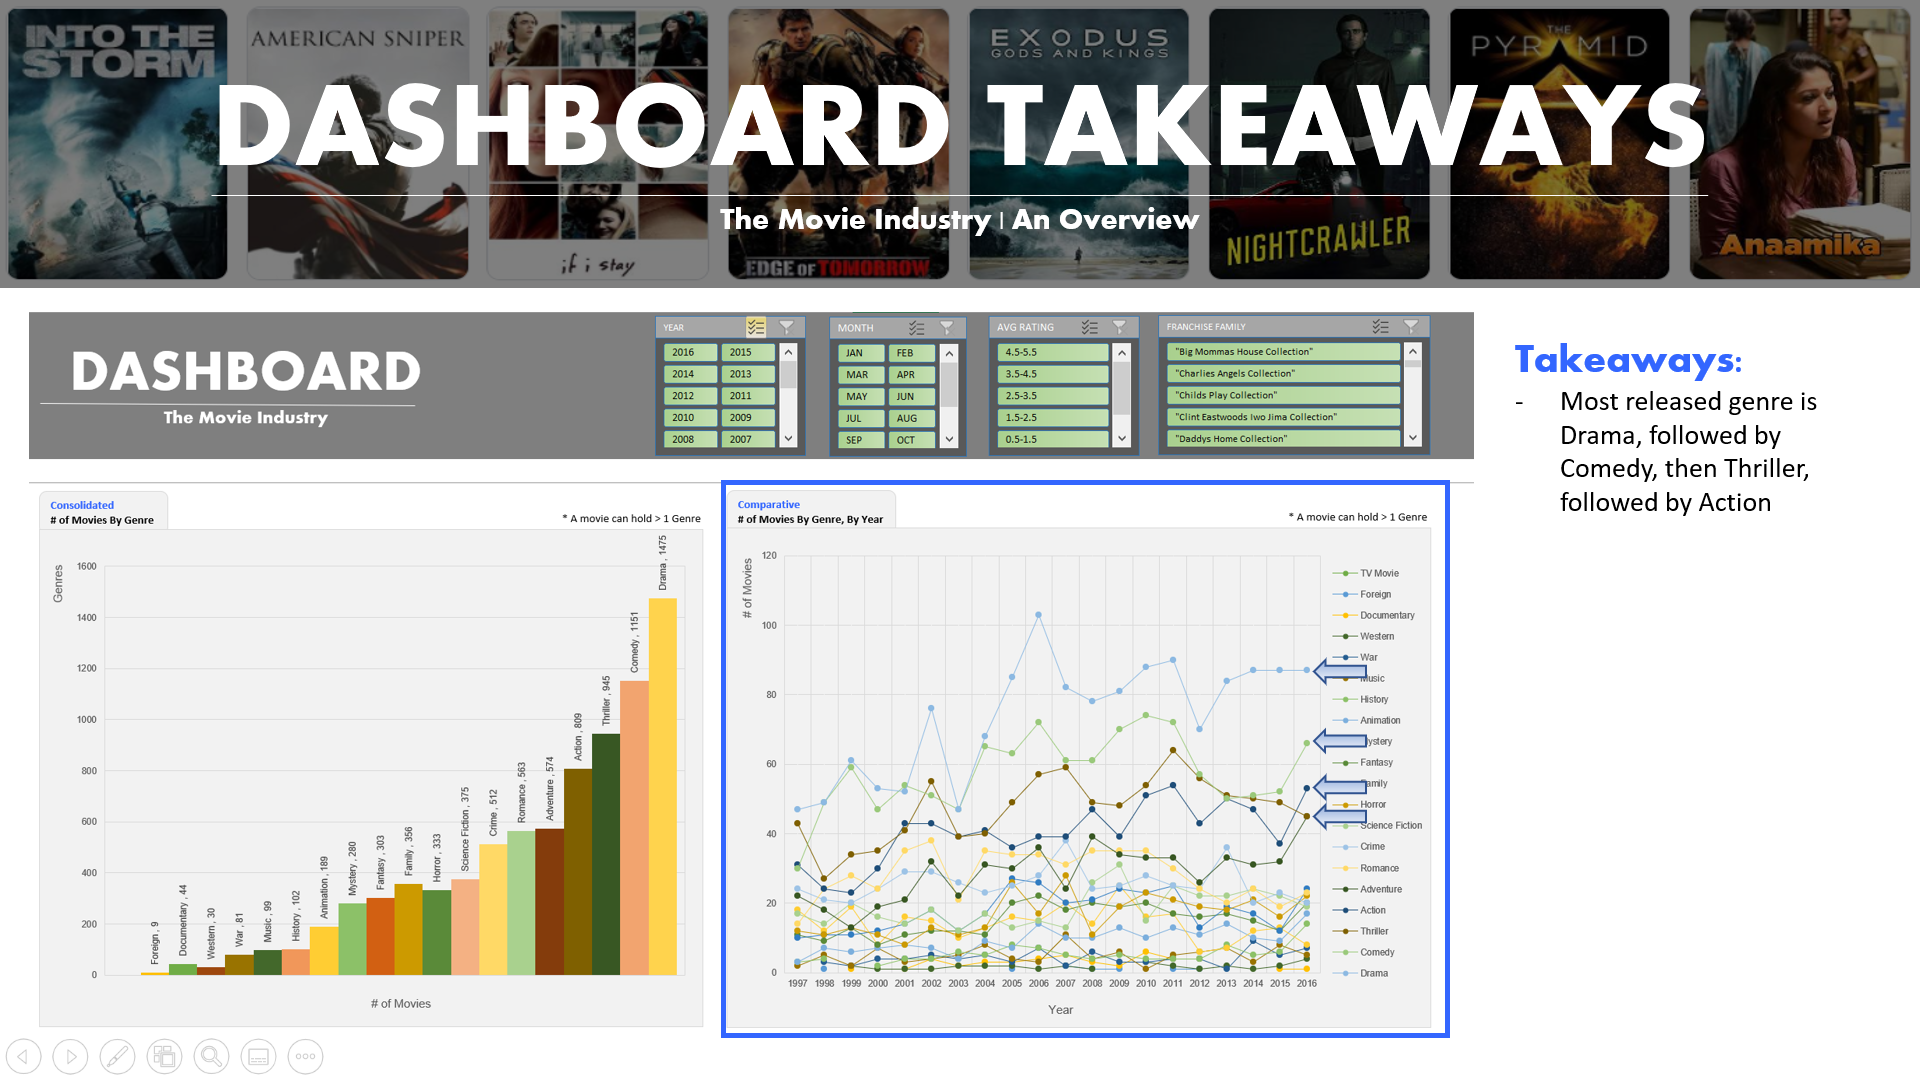
Most released genre is Drama, followed by Comedy, then Thriller, followed by Action
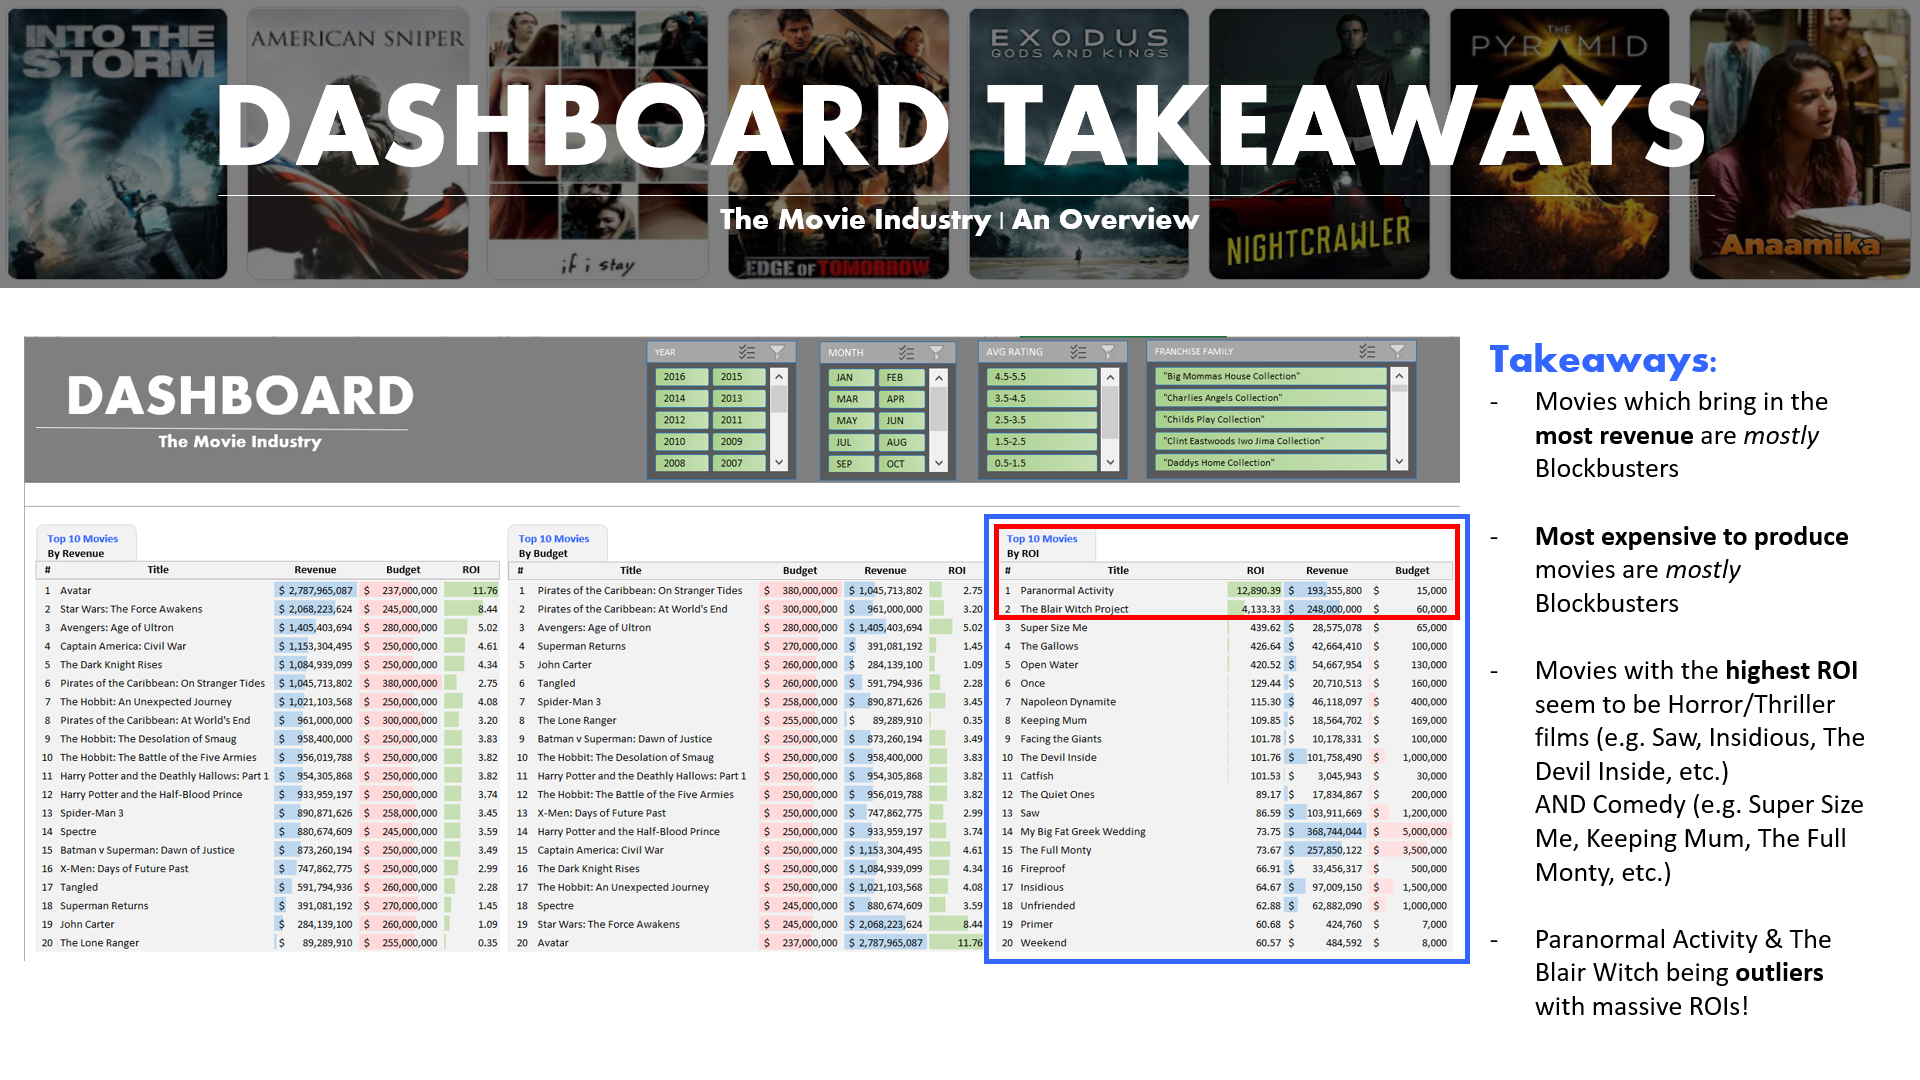
- Movies which bring in the most revenue are mostly Blockbusters
- Most expensive to produce movies are mostly Blockbusters
- Movies with the highest ROI seem to be Horror/Thriller films (eg. Saw, Insidious, The Devil Inside, etc.) AND Comedy (eg. Super Size Me, Keeping Mum, The Full Monty, etc.)
-
Paranormal Activitiy, and The Blair Witch Project being outliers with massive ROIs!
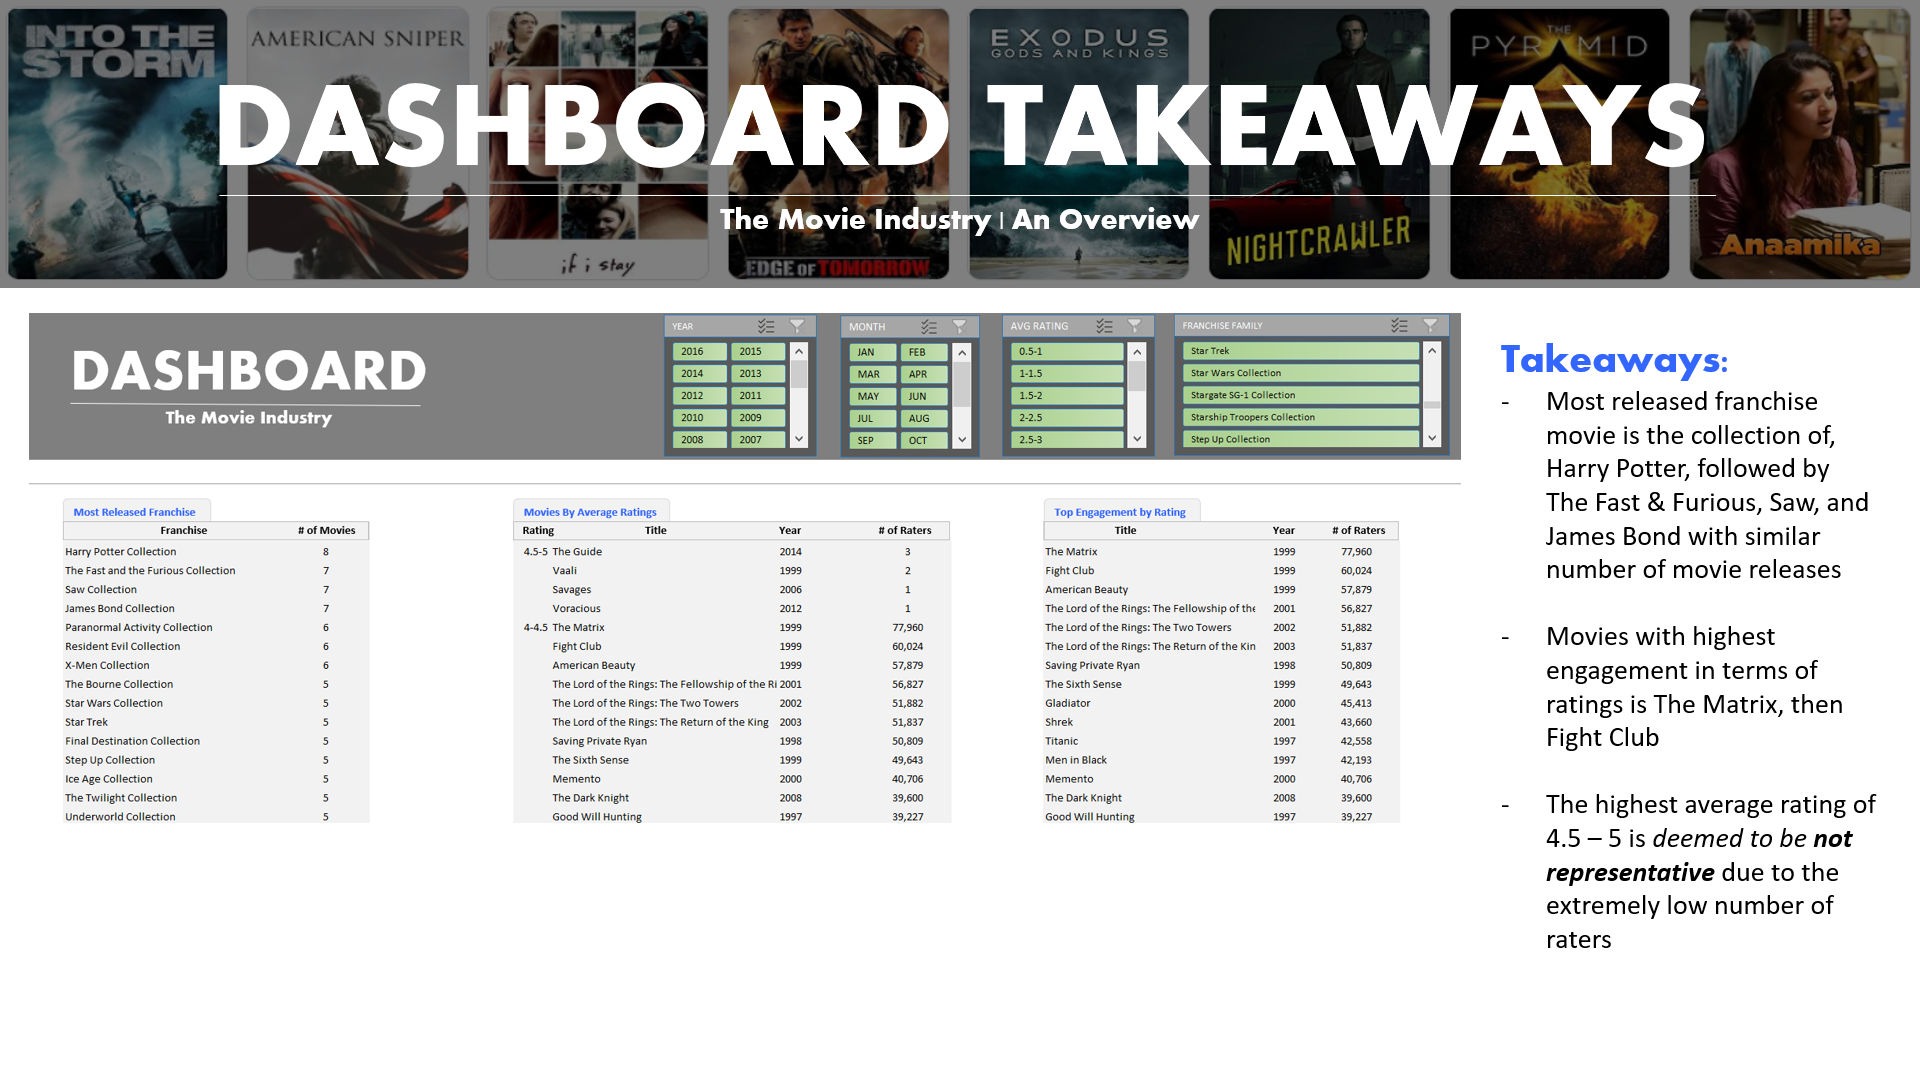
- Most released franchise movie is the collection of, Harry Potter, followed by The Fast & Furious, Saw, and James Bond with similar number of movie releases
- Movies with the highest engagement in terms of ratings is The Matrix, then Fight Club
- The highest average rating of 4.5 - 5 is deemed to be not representative due to the extrememly low number of raters
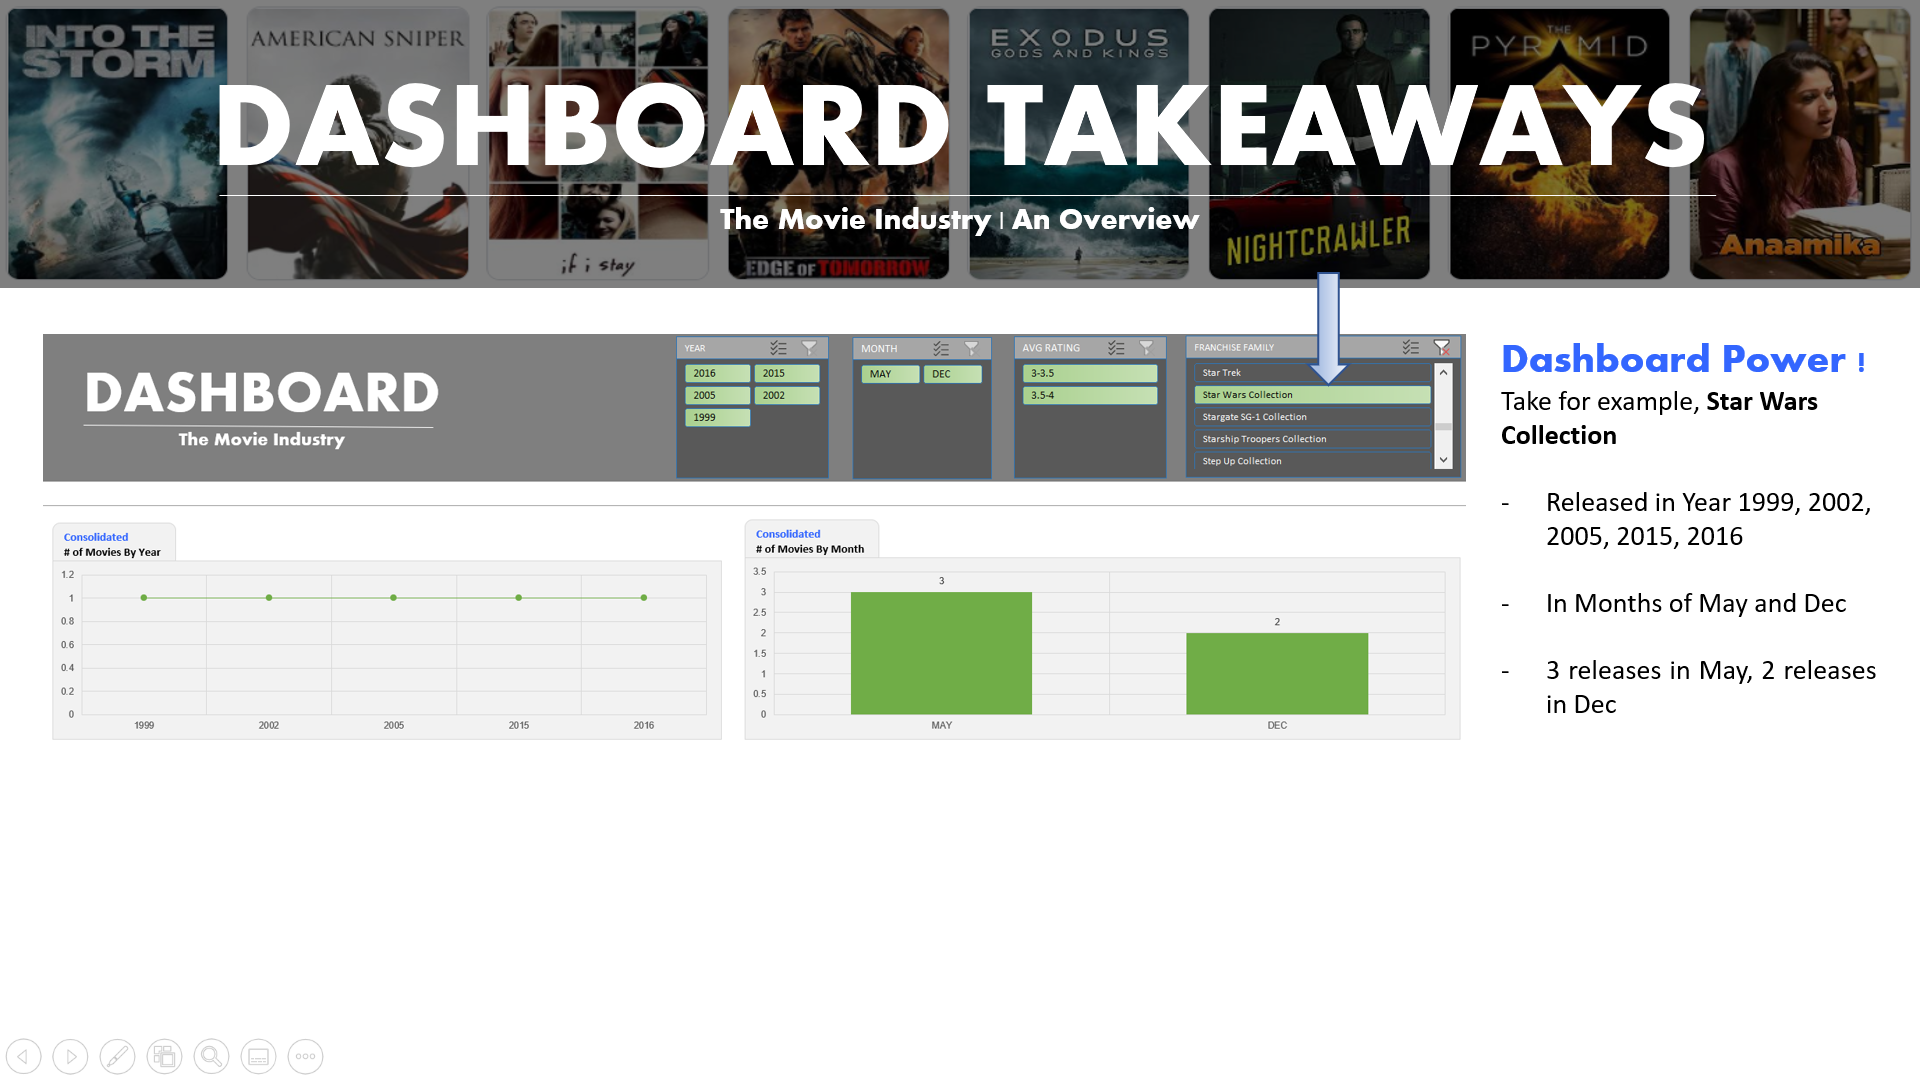
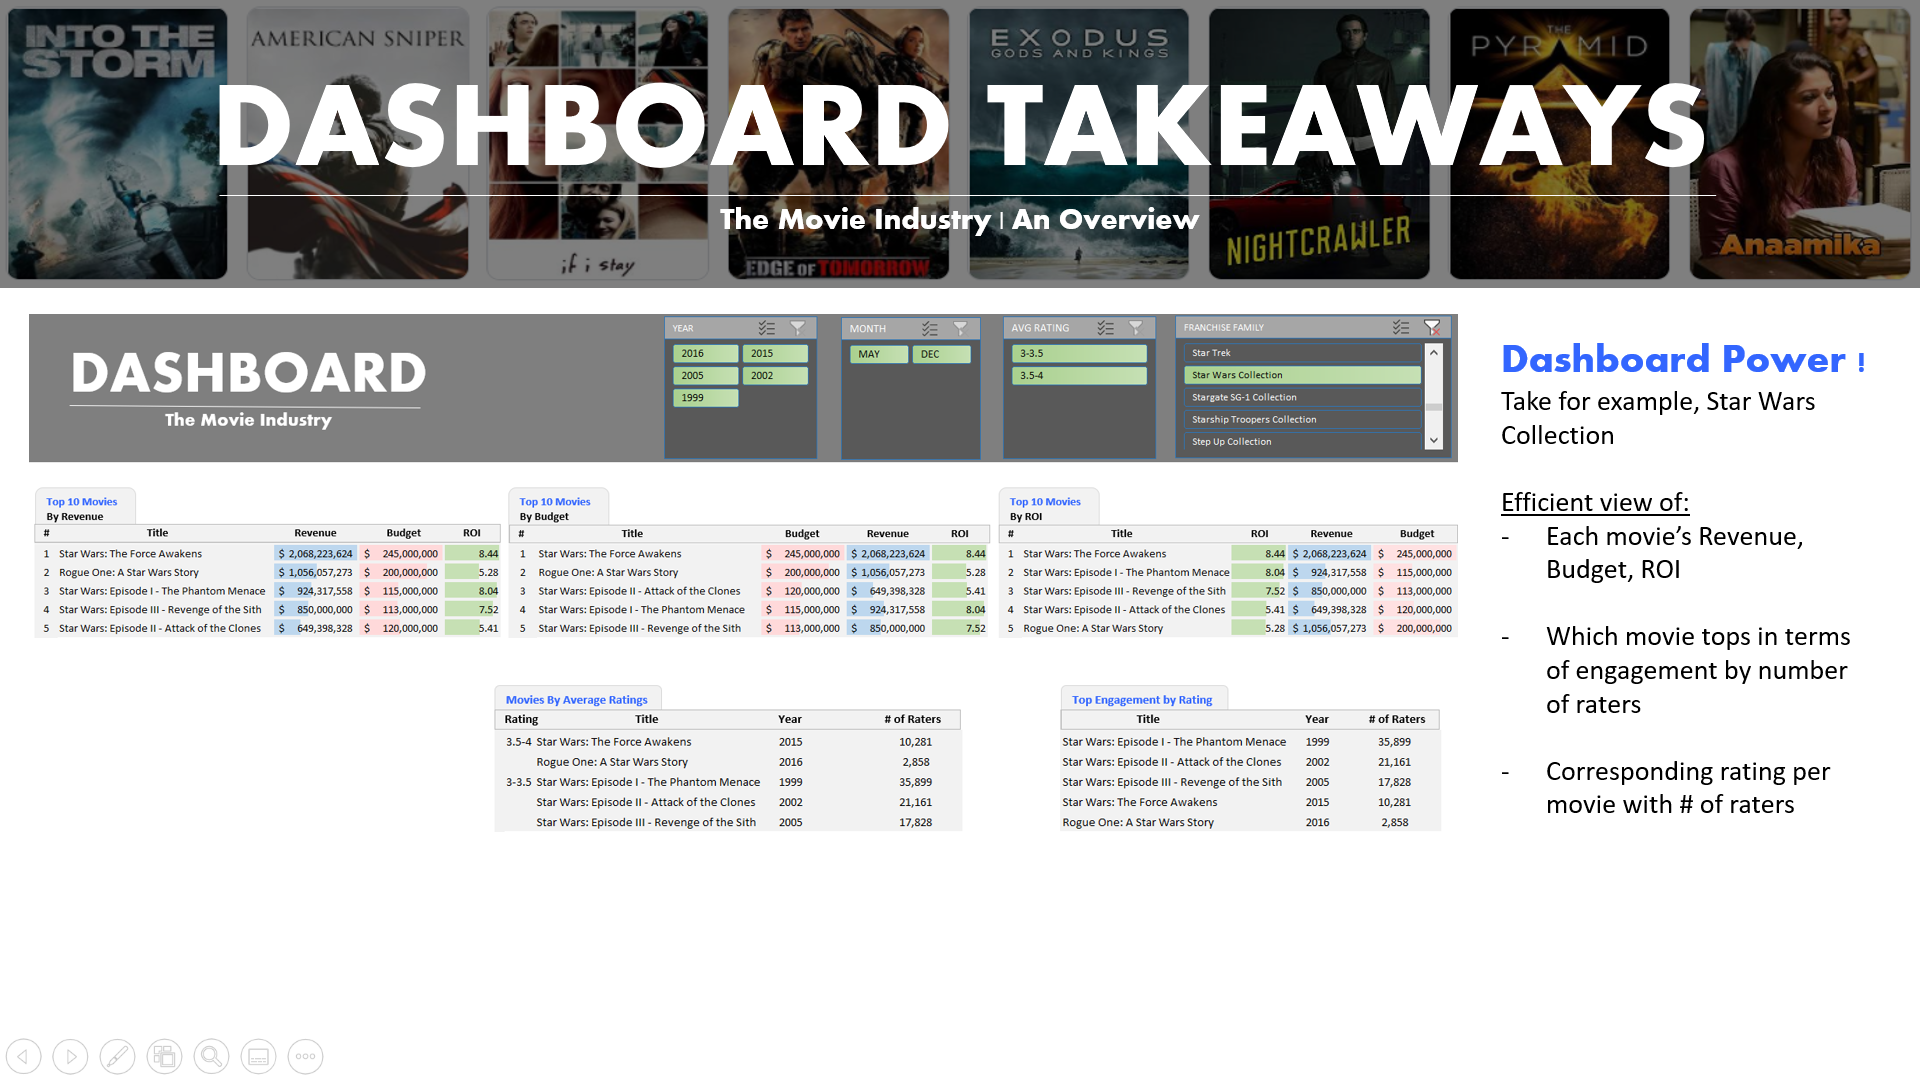
I showed the Boss how to work the Excel Interactive Dashboard by using the slicers… by taking the Star Wars Collection as an example. It was:
- Released in Year 1999, 2002, 2005, 2015, 2016
- In months of May and December
- 3 releases in May, 2 releases in December
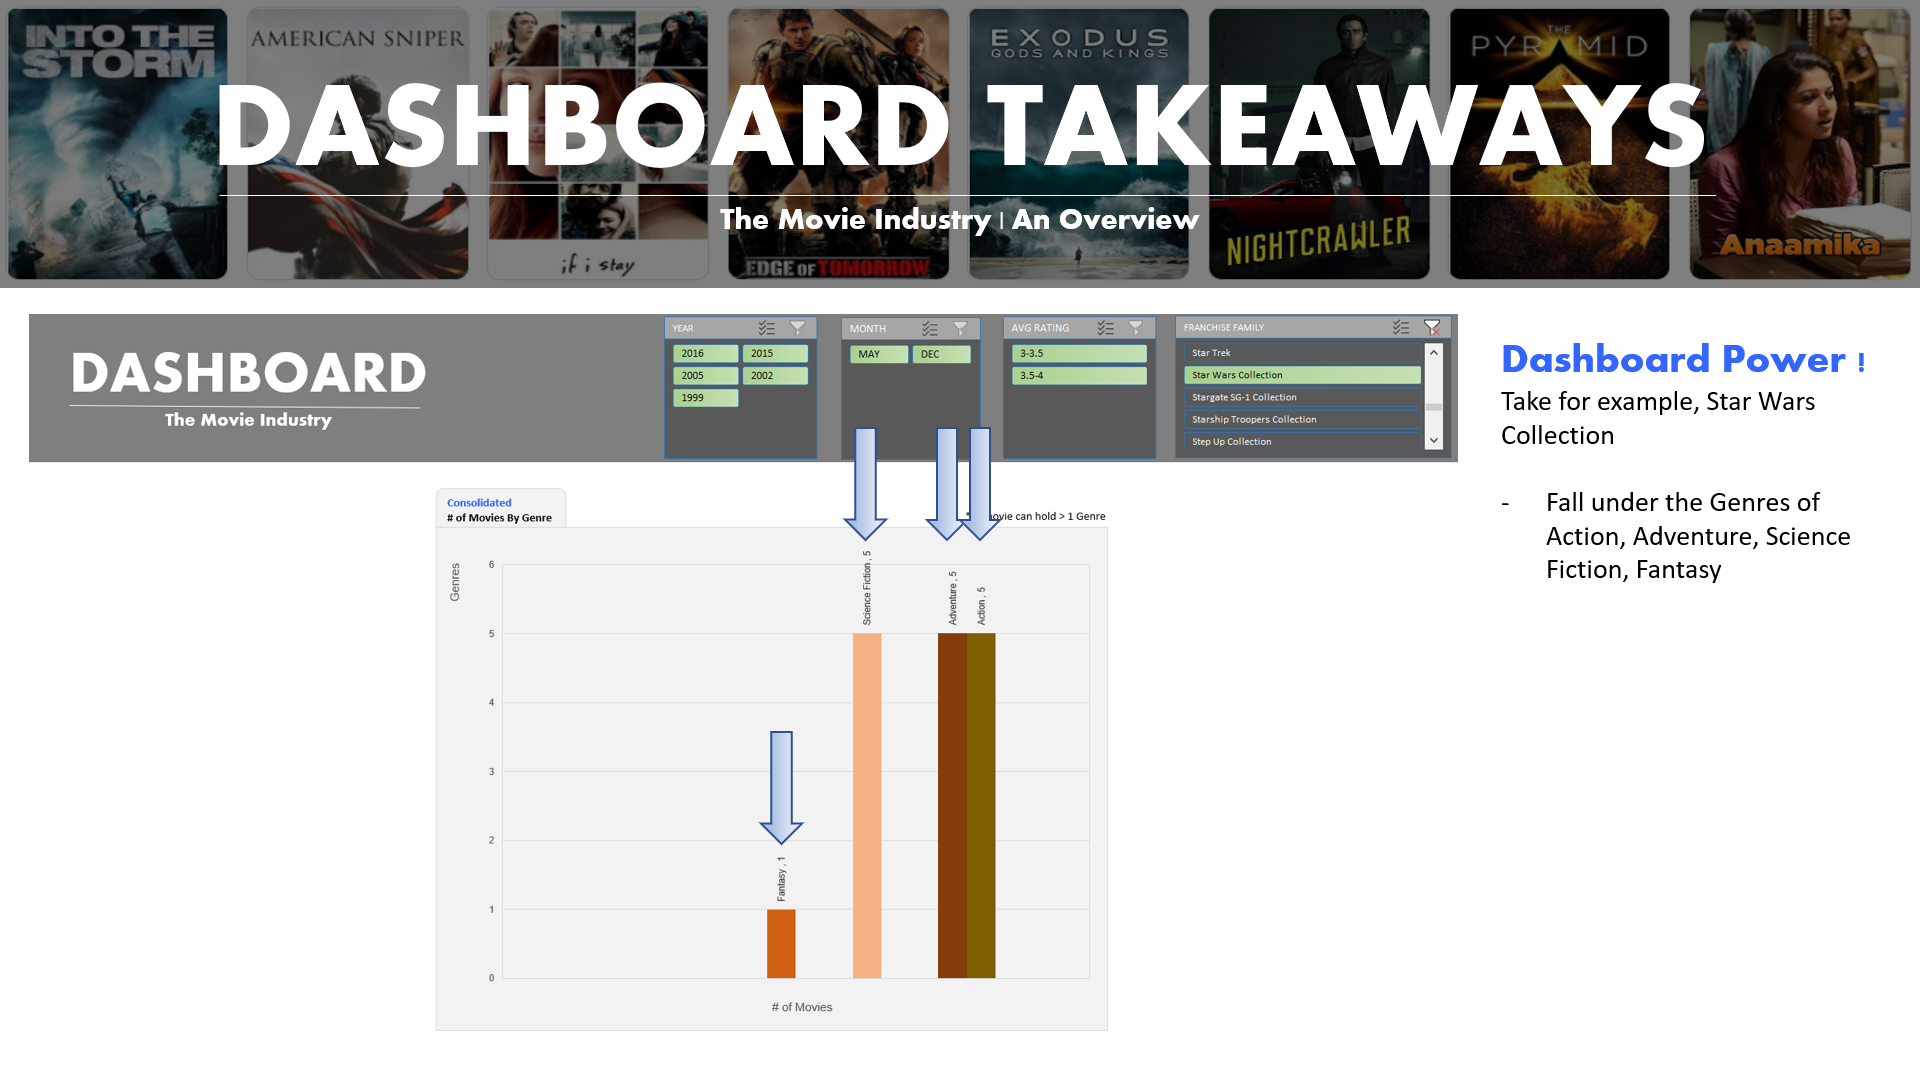
The Star Wars Collection falls under the genres of Action, Adventure, Science, Fiction, Fantasy
The Dashboard would give him an efficient view of:
- Each movie’s Revenue, Budget, ROI
- Which movie tops in terms of engagement by number of raters
- corresponding rating per movie with number of raters
With my final suggestion to start off with a high return on investment movie (Horror/Thriller genre)…
The Boss is very pleased.
I aced the project.
I am pleased.
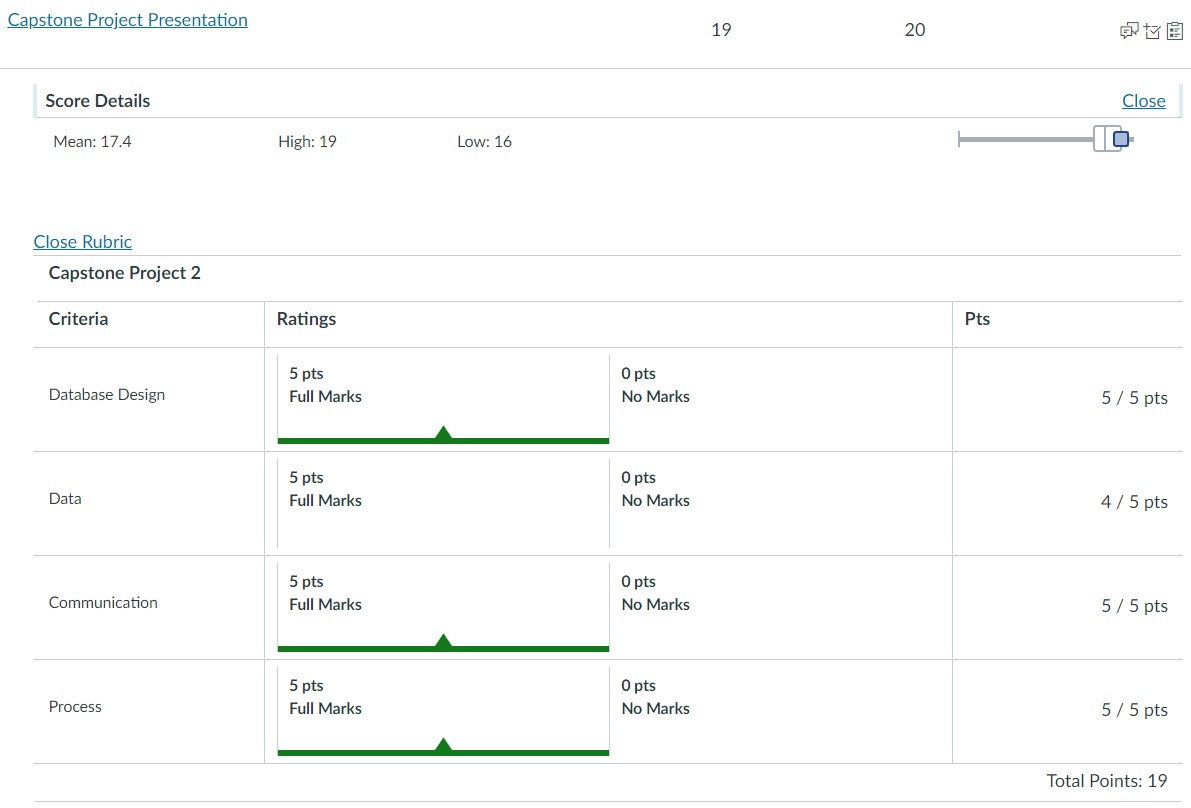
I scored a 19 out of 20.
Project Scoring Rubrics
We were rated based on the following 4 components:
- Database Design (5 points)
- Data (5 points)
- Communication (5 points)
- Process (5 points)
Contact me
| https://www.linkedin.com/in/megan-ng-7708a74/ | |
| megan_ng@hotmail.com |
Hosted on GitHub Pages — Theme by orderedlist
